网络分析|GIS网络分析( 四 )
disjoint_union(G1,G2) - graph union assuming all nodes are different
cartesian_product(G1,G2) - return Cartesian product graph
compose(G1,G2) - combine graphs identifying nodes common to both
complement(G) - graph complement
create_empty_copy(G) - return an empty copy of the same graph class
convert_to_undirected(G) - return an undirected representation of G
convert_to_directed(G) - return a directed representation of G
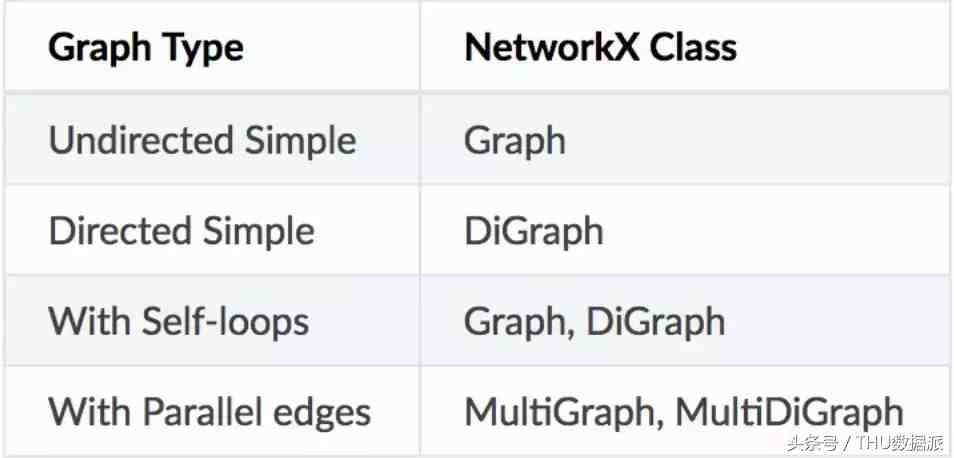
对于不同类型的图 , 存在单独的类 。例如 , nx.DiGraph类允许创建有向图 。可以使用单个方法直接创建包含路径的特定图 。有关图创建方法的完整列表 , 请参阅完整文档 。链接在本文末尾给出 。
Image('images/graphclasses.PNG', width = 400)
访问边和节点
可以使用G.nodes和G.edges方法访问节点和边 。可以使用括号/下标法访问各个节点和边 。
G.nodes()图可视化
NodeView((1, 2, 3))
G.edges()
EdgeView([(1, 2), (1, 3), (2, 3)])
G[1] # same as G.adj[1]
AtlasView({2: {}, 3: {}})
G[1][2]
{}
G.edges[1, 2]
{}
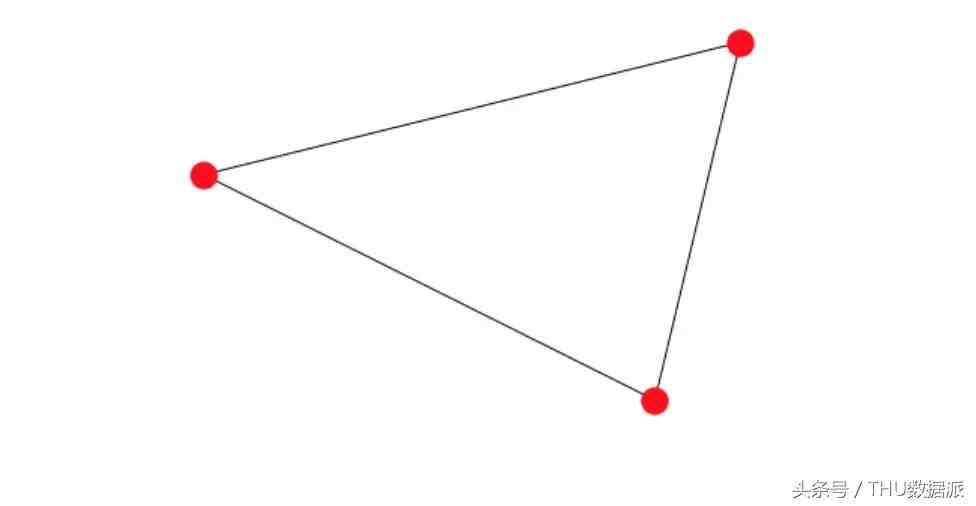
Networkx提供了可视化图的基本功能 , 但其主要目标是帮助图分析而不是图的可视化 。图可视化很难 , 我们将使用专门用于此任务的工具 。Matplotlib提供了一些便利功能 。但是GraphViz可能是最好的工具 , 因为它提供了一个PyGraphViz的Python接口(链接在文档的末尾) 。
%matplotlib inline
import matplotlib.pyplot as plt
nx.draw(G)
首先必须安装Graphviz 。然后使用该命令pip install pygraphviz --install-option =“<> 。在安装选项中 , 你必须提供Graphviz 中lib和include文件夹的路径 。
import pygraphviz as pgvPyGraphviz可以很好地控制边和节点的各个属性 。我们可以使用它获得非常漂亮的可视化 。
d={'1': {'2': None}, '2': {'1': None, '3': None}, '3': {'1': None}}
A = pgv.AGraph(data=http://www.2312333.com/list15/d)
print(A) # This is the 'string' or simple representation of the Graph
Output:
strict graph "" {
1 -- 2;
2 -- 3;
3 -- 1;
}
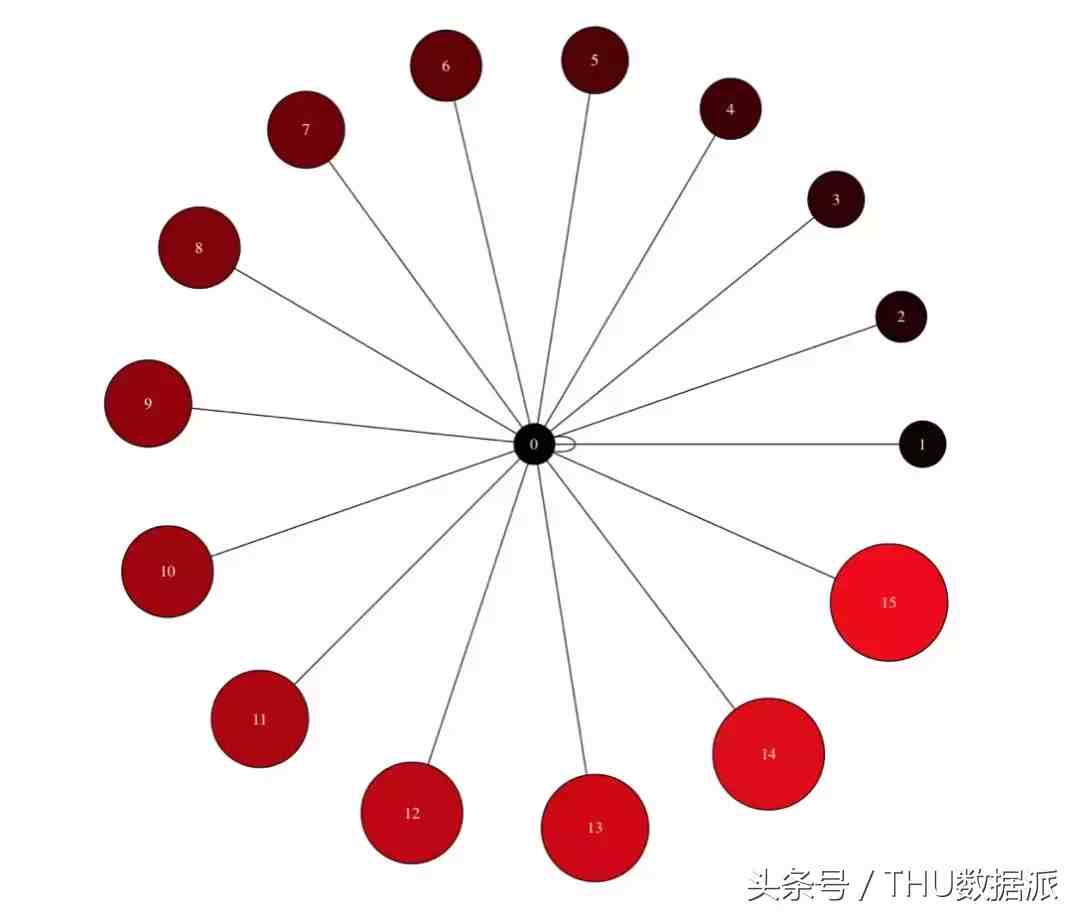
# Let us create another Graph where we can individually control the colour of each node
B = pgv.AGraph()
# Setting node attributes that are common for all nodes
B.node_attr['style']='filled'
B.node_attr['shape']='circle'
B.node_attr['fixedsize']='true'
B.node_attr['fontcolor']='#FFFFFF'
# Creating and setting node attributes that vary for each node (using a for loop)
for i in range(16):
【网络分析|GIS网络分析】
B.add_edge(0,i)
n=B.get_node(i)
n.attr['fillcolor']="#%2x0000"%(i*16)
n.attr['height']="%s"%(i/16.0+0.5)
n.attr['width']="%s"%(i/16.0+0.5)
B.draw('star.png',prog="circo") # This creates a .png file in the local directory. Displayed below.
Image('images/star.png', width=650) # The Graph visualization we created above.
通常 , 可视化被认为是与图分析独立的任务 。分析后的图将导出为Dotfile 。然后单独显示该Dotfile以展示我们想表达的内容 。
数据分析案例
我们将寻找一个通用数据集(不是专门用于图的数据集)并进行一些操作(在pandas中) , 以便它可以以边列表(edge list)的形式输入到图中 。边列表是一个元组列表 , 其中的元组包含定义每条边的顶点
我们将关注的数据集来自航空业 。它有一些关于航线的基本信息 。有某段旅程的起始点和目的地 。还有一些列表示每段旅程的到达和起飞时间 。如你所想 , 这个数据集非常适合作为图进行分析 。想象一下通过航线(边)连接的几个城市(节点) 。如果你是航空公司 , 你可以问如下几个问题:
从A到B的最短途径是什么?分别从距离和时间角度考虑 。
有没有办法从C到D?
哪些机场的交通最繁忙?
哪个机场位于大多数其他机场“之间”?这样它就可以变成当地的一个中转站 。
import pandas as pd
import numpy as np
data = http://www.2312333.com/list15/pd.read_csv('data/Airlines.csv')
data.shape
(100, 16)
data.dtypes
- 走出洞穴
- 网络小说|十大巅峰网络小说排行榜 最顶级的网络小说推荐
- 绘本《重阳节》
- 神兽|网络最火十大神兽,网络神兽有什么
- 网络工程师转正述职报告怎么写?
- 网络营销工作计划怎么写?
- 年网络管理员简历模版如何写?
- 考试后总结范文有没有?
- 职场礼仪的重要性分析怎么写?
- 网络工程求职信格式怎么样?